Claude Code Token 費用分析:費用計算、工具統計與 Web Dashboard 實作
這個章節要説明關於 Claude Code Analytics 的部分内容
計算 token 費用、分析工具使用模式、建立 Web Dashboard
首先加入 Token 計算器
這邊要查詢所有 session,計算每個 session 的 token 用量與美金費用
新增費用計算模組
新增 lib/costs.mjs:
const PRICING = {
  'claude-opus-4':   { in: 15,   out: 75,   cw: 18.75, cr: 1.50 },
  'claude-sonnet-4': { in: 3,    out: 15,   cw: 3.75,  cr: 0.30 },
  'claude-haiku-4':  { in: 0.80, out: 4,    cw: 1.00,  cr: 0.08 },
};

/**
 * 從 model ID 推斷定價方案
 */
function getPricing(modelId) {
  const id = modelId?.toLowerCase() ?? '';
  if (id.includes('opus'))  return PRICING['claude-opus-4'];
  if (id.includes('haiku')) return PRICING['claude-haiku-4'];
  return PRICING['claude-sonnet-4'];
}

/**
 * 計算單條 assistant 訊息的費用
 */
export function calcMessageCost(msg) {
  if (msg.type !== 'assistant') return 0;
  const usage = msg.message?.usage;
  if (!usage) return 0;

  const p = getPricing(msg.message?.model);
  const M = 1_000_000;
  return (
    (usage.input_tokens ?? 0) / M * p.in +
    (usage.output_tokens ?? 0) / M * p.out +
    (usage.cache_creation_input_tokens ?? 0) / M * p.cw +
    (usage.cache_read_input_tokens ?? 0) / M * p.cr
  );
}

/**
 * 計算整個 session 的 token 統計與費用
 */
export function calcSessionStats(messages) {
  let input = 0, output = 0, cacheWrite = 0, cacheRead = 0, costUSD = 0;
  let models = new Set();
  let toolCalls = 0, toolErrors = 0;

  for (const msg of messages) {
    if (msg.type !== 'assistant') continue;

    const usage = msg.message?.usage;
    if (usage) {
      input     += usage.input_tokens ?? 0;
      output    += usage.output_tokens ?? 0;
      cacheWrite += usage.cache_creation_input_tokens ?? 0;
      cacheRead  += usage.cache_read_input_tokens ?? 0;
      costUSD   += calcMessageCost(msg);
    }

    if (msg.message?.model) models.add(msg.message.model);

    for (const c of msg.message?.content ?? []) {
      if (c.type === 'tool_use') toolCalls++;
    }
  }

  // 計算 tool 錯誤數(在 user 的 tool_result 中)
  for (const msg of messages) {
    if (msg.type !== 'user') continue;
    for (const c of msg.message?.content ?? []) {
      if (c.type === 'tool_result' && c.is_error) toolErrors++;
    }
  }

  return {
    input_tokens: input,
    output_tokens: output,
    cache_write_tokens: cacheWrite,
    cache_read_tokens: cacheRead,
    total_tokens: input + output + cacheWrite + cacheRead,
    cost_usd: costUSD,
    models: [...models],
    tool_calls: toolCalls,
    tool_errors: toolErrors,
  };
}
新增 Token 報告腳本
新增 token-report.mjs:
import { scanProjects, scanProjectSessions } from './lib/scanner.mjs';
import { parseJsonl } from './lib/parser.mjs';
import { calcSessionStats } from './lib/costs.mjs';

const DAYS = parseInt(process.argv[2] ?? '30', 10);
const cutoff = new Date();
cutoff.setDate(cutoff.getDate() - DAYS);

console.log(`\n Claude Code Token 報告(過去 ${DAYS} 天)\n`);

let totalCost = 0;
let totalTokens = 0;
let totalSessions = 0;
const projectStats = [];

for (const proj of scanProjects()) {
  let projCost = 0;
  let projTokens = 0;
  let projSessions = 0;

  for (const session of scanProjectSessions(proj)) {
    const sessionStart = new Date(session.first_message_time);
    if (sessionStart < cutoff) continue;

    const messages = parseJsonl(session.file_path);
    const stats = calcSessionStats(messages);

    projCost    += stats.cost_usd;
    projTokens  += stats.total_tokens;
    projSessions++;
  }

  if (projSessions === 0) continue;

  projectStats.push({
    name: proj.name.slice(0, 35),
    sessions: projSessions,
    tokens: projTokens,
    cost: projCost,
  });

  totalCost    += projCost;
  totalTokens  += projTokens;
  totalSessions += projSessions;
}

// 排序並輸出
projectStats.sort((a, b) => b.cost - a.cost);

console.log('專案費用排行:\n');
console.log('  ' + '專案名稱'.padEnd(36) + 'Sessions'.padStart(9) + '  Tokens'.padStart(12) + '  費用 (USD)'.padStart(12));
console.log('  ' + '─'.repeat(72));

for (const p of projectStats) {
  const name = p.name.padEnd(36);
  const sess = String(p.sessions).padStart(9);
  const tok  = p.tokens.toLocaleString().padStart(12);
  const cost = `$${p.cost.toFixed(4)}`.padStart(12);
  console.log(`  ${name}${sess}  ${tok}  ${cost}`);
}

console.log('\n' + '  ' + '─'.repeat(72));
console.log(`  ${'合計'.padEnd(36)}${String(totalSessions).padStart(9)}  ${totalTokens.toLocaleString().padStart(12)}  ${'$'+totalCost.toFixed(4)}`);

// 平均費用
if (totalSessions > 0) {
  console.log(`\n平均每 session 費用:$${(totalCost / totalSessions).toFixed(4)}`);
  console.log(`平均每天費用:       $${(totalCost / DAYS).toFixed(4)}`);
  console.log(`估算月費用:         $${(totalCost / DAYS * 30).toFixed(2)}`);
}
過去 7 天
node token-report.mjs 7
專案費用排行:

  專案名稱                                 Sessions      Tokens    費用 (USD)
  ────────────────────────────────────────────────────────────────────────
  D--OlgCase-R****R-3                        7   184,270,495     $498.5703
  D--Git-Cla*-***deEg                         2   102,513,672     $252.1710
  d--Git-obsi-w****e-brain                 3    89,158,775     $248.8697
...
  ────────────────────────────────────────────────────────────────────────
  合計                                         28   463,693,230  $1297.4101

平均每 session 費用:$46.3361
平均每天費用:       $185.3443
估算月費用:         $5560.33
這章節新增 Session Analytics
分析工具使用頻率統計,加上用活躍時段直方圖來表現
新增 Analytics 模組
新增 lib/analytics.mjs:
import { parseJsonl } from './parser.mjs';

/**
 * 提取所有工具呼叫
 */
export function extractToolCalls(messages) {
  const calls = [];
  for (const msg of messages) {
    if (msg.type !== 'assistant') continue;
    for (const c of msg.message?.content ?? []) {
      if (c.type === 'tool_use') {
        calls.push({ name: c.name, timestamp: msg.timestamp });
      }
    }
  }
  return calls;
}

/**
 * 計算工具使用頻率
 */
export function toolFrequency(sessions) {
  const freq = {};
  for (const { messages } of sessions) {
    for (const call of extractToolCalls(messages)) {
      freq[call.name] = (freq[call.name] ?? 0) + 1;
    }
  }
  return Object.entries(freq)
    .sort(([, a], [, b]) => b - a)
    .map(([name, count]) => ({ name, count }));
}

/**
 * 計算活躍時段(0-23 時)
 */
export function activeHours(sessions) {
  const hours = new Array(24).fill(0);
  for (const { first_message_time } of sessions) {
    const h = new Date(first_message_time).getHours();
    hours[h]++;
  }
  return hours;
}

/**
 * 計算活躍星期(0=週日...6=週六)
 */
export function activeDays(sessions) {
  const days = new Array(7).fill(0);
  const dayNames = ['週日','週一','週二','週三','週四','週五','週六'];
  for (const { first_message_time } of sessions) {
    const d = new Date(first_message_time).getDay();
    days[d]++;
  }
  return days.map((count, i) => ({ day: dayNames[i], count }));
}

/**
 * 命令列直方圖(最大寬度 30 格)
 */
export function cliHistogram(data, labelKey, valueKey, title) {
  const max = Math.max(...data.map(d => d[valueKey]), 1);
  console.log(`\n${title}\n`);
  for (const item of data) {
    const bar = '█'.repeat(Math.round(item[valueKey] / max * 30));
    const label = String(item[labelKey]).padStart(6);
    console.log(`  ${label} ${bar.padEnd(30)} ${item[valueKey]}`);
  }
}
新增 Analytics 報告腳本
新增 analytics-report.mjs:
import { scanProjects, scanProjectSessions } from './lib/scanner.mjs';
import { parseJsonl } from './lib/parser.mjs';
import { toolFrequency, activeHours, activeDays, cliHistogram } from './lib/analytics.mjs';

// 載入所有近 30 天的 sessions
const DAYS = 30;
const cutoff = new Date();
cutoff.setDate(cutoff.getDate() - DAYS);

const allSessions = [];

for (const proj of scanProjects()) {
  for (const session of scanProjectSessions(proj)) {
    if (new Date(session.first_message_time) < cutoff) continue;
    const messages = parseJsonl(session.file_path);
    allSessions.push({ ...session, messages });
  }
}

console.log(`\n Claude Code 使用分析(過去 ${DAYS} 天,${allSessions.length} 個 sessions)\n`);

// 1. 工具頻率
const freqData = toolFrequency(allSessions).slice(0, 12);
cliHistogram(freqData, 'name', 'count', ' 工具使用頻率 TOP 12');

// 2. 活躍時段
const hours = activeHours(allSessions);
const hourData = hours.map((count, h) => ({ label: `${String(h).padStart(2,'0')}:00`, count }));
cliHistogram(hourData, 'label', 'count', ' 活躍時段分析(每小時 session 數)');

// 3. 活躍星期
const dayData = activeDays(allSessions);
cliHistogram(dayData, 'day', 'count', ' 活躍星期分析');

// 4. 最高效 session(工具數 / 來回輪數 比例)
const ranked = allSessions
  .map(s => {
    const turns = s.messages.filter(m => m.type === 'assistant').length;
    const tools = s.messages.flatMap(m =>
      m.type === 'assistant' ? (m.message?.content ?? []).filter(c => c.type === 'tool_use') : []
    ).length;
    return { ...s, turns, tools, efficiency: turns > 0 ? tools / turns : 0 };
  })
  .sort((a, b) => b.efficiency - a.efficiency)
  .slice(0, 5);

console.log('\n 工具密度最高的 Sessions(每輪工具數)\n');
for (const s of ranked) {
  const date = new Date(s.first_message_time).toLocaleDateString();
  const summary = (s.summary ?? '(無摘要)').slice(0, 50);
  console.log(`  [${date}] ${s.turns}輪  ${s.tools}個工具  效率:${s.efficiency.toFixed(1)}`);
  console.log(`           ${summary}`);
}
結果如下:
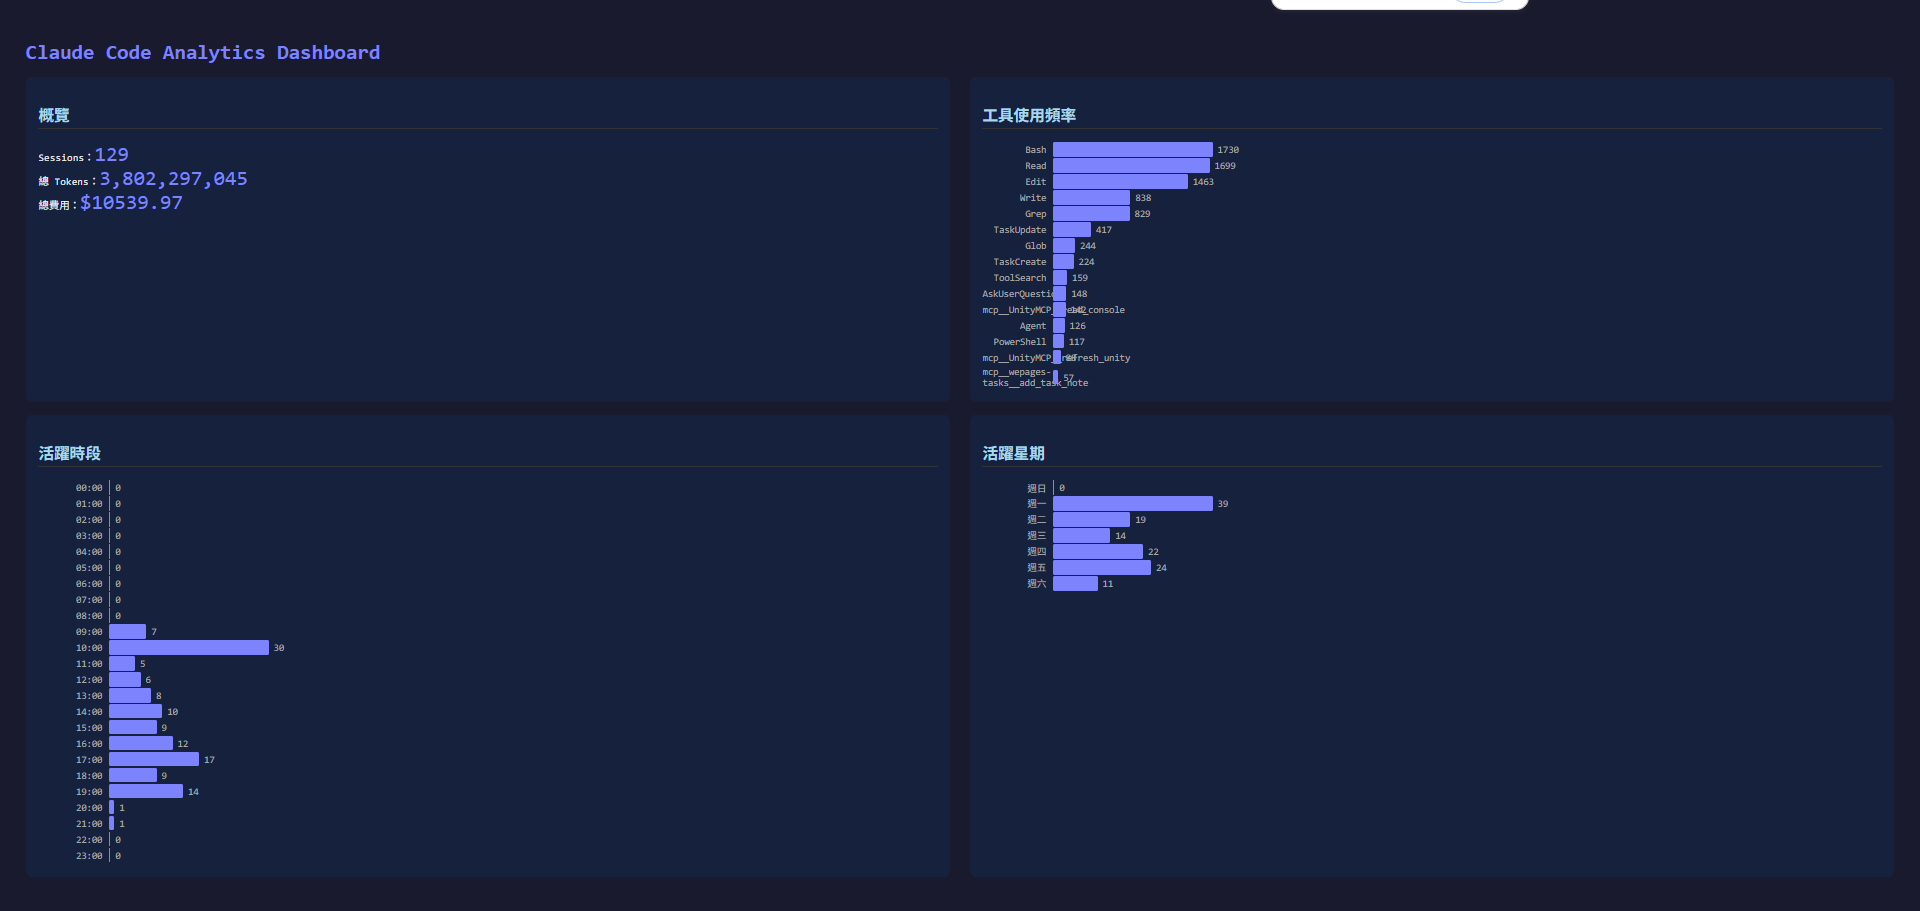
 Claude Code 使用分析(過去 30 天,129 個 sessions)


 工具使用頻率 TOP 12

    Bash ██████████████████████████████ 1730
    Read █████████████████████████████  1699
    Edit █████████████████████████      1463
   Write ███████████████                838
    Grep ██████████████                 829
  TaskUpdate ███████                        417
    Glob ████                           244
  TaskCreate ████                           224
  ToolSearch ███                            159
  AskUserQuestion ███                            148
  mcp__UnityMCP__read_console ██                             142
   Agent ██                             126

 活躍時段分析(每小時 session 數)

   00:00                                0
   01:00                                0
   02:00                                0
   03:00                                0
   04:00                                0
   05:00                                0
   06:00                                0
   07:00                                0
   08:00                                0
   09:00 ███████                        7
   10:00 ██████████████████████████████ 30
   11:00 █████                          5
   12:00 ██████                         6
   13:00 ████████                       8
   14:00 ██████████                     10
   15:00 █████████                      9
   16:00 ████████████                   12
   17:00 █████████████████              17
   18:00 █████████                      9
   19:00 ██████████████                 14
   20:00 █                              1
   21:00 █                              1
   22:00                                0
   23:00                                0

 活躍星期分析

      週日                                0
      週一 ██████████████████████████████ 39
      週二 ███████████████                19
      週三 ███████████                    14
      週四 █████████████████              22
      週五 ██████████████████             24
      週六 ████████                       11

⚡ 工具密度最高的 Sessions(每輪工具數)

  [2026/5/11] 30輪  24個工具  效率:0.8
           (無摘要)
  [2026/5/13] 321輪  236個工具  效率:0.7
           (無摘要)
  [2026/5/14] 137輪  100個工具  效率:0.7
           (無摘要)
  [2026/5/21] 22輪  16個工具  效率:0.7
           (無摘要)
  [2026/5/28] 51輪  37個工具  效率:0.7
           (無摘要)
最後面建立 Dashboard HTML
這邊就不多説了直接展示效果
node server.mjs
# 開啟瀏覽器:http://localhost:3000/dashboard.html